
These are live cameras - best viewed between 7:00 am and 4:30 pm Central Time.
There is much more to see at explore.org
.


A female polar bear swam for a record-breaking nine days straight, traversing 426 miles (687 kilometers) of water—equivalent to the distance between Washington, D.C., and Boston, a new study says.
The predator made her epic journey in the Beaufort Sea (see map), where sea ice is shrinking due to global warming, forcing mother bears to swim greater and greater distances to reach land—to the peril of their cubs.
The cub of the record-setting bear, for instance, died at some point between starting the swim and when the researchers next observed the mother on land. She also lost 22 percent of her body weight.
The world’s climate is inherently dynamic and changeable. Past eons have borne witness to a planet choked by intense volcanic activity, dried out in vast circumglobal deserts, heated to a point where polar oceans were as warm as subtropical seas, and frozen in successive ice ages that entombed northern Eurasia and America under miles of ice. These changes to the Earth’s environment imposed great stresses upon ecosystems and often led to mass extinctions of species. Life always went on, but the world was inevitably a very different place.
We, a single species, are now the agent of global change. We are undertaking an unplanned and unprecedented experiment in planetary engineering, which has the potential to unleash physical and biological transformations on a scale never before witnessed by civilization.
When climate change is discussed in the modern context, it is usually with reference to global warming, caused by anthropogenic pollution from the burning of fossil fuels. Since the furnaces of the industrial revolution were first ignited a few centuries ago, we have treated the atmosphere as an open sewer, dumping into it more a trillion tonnes of heat-trapping carbon dioxide (CO2), as well as methane, nitrous oxide and ozone-destroying CFCs. The atmospheric concentration of CO2 is now nearly 40% higher than at any time over the past million years...
To examine possible tipping points in the earth's systems, the authors of the article, Tipping elements in the Earth's climate system, gathered data, reviewed literature and solicited opinions from climate experts on potential tipping elements in the earth's climate systems. Table 1 outlines nine of the most policy-relevant tipping elements they examined, the amount of global warming needed to cause the elements to tip, the timescales for warming, and a summary of key impacts of the warming.
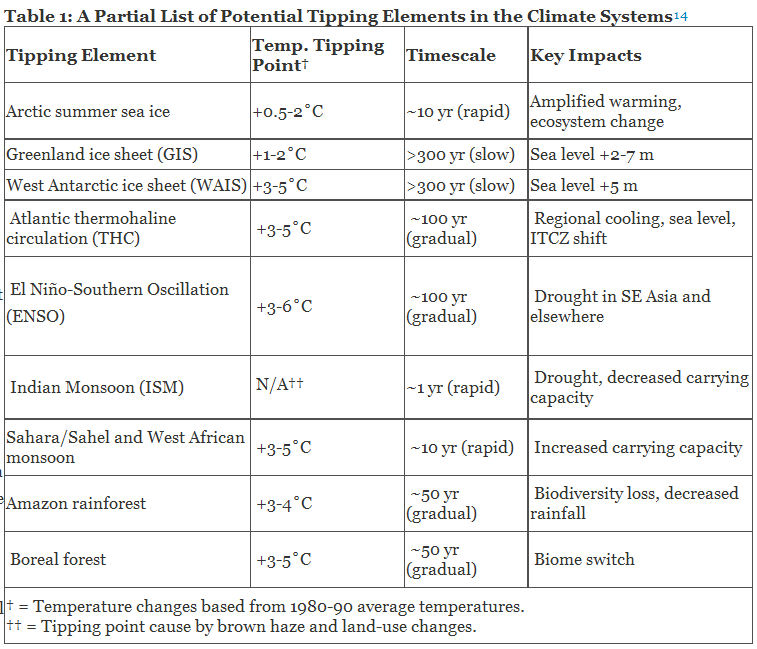
The authors of this study conclude that summer Arctic sea ice may be lost within 10 years. A number of other climate scientists note that albedo feedback makes summer and fall sea ice sensitive to moderate increases in temperature and that studies have shown that once sea ice retreats to a certain point, remaining ice can be lost without additional temperature increases. Concerns that the Arctic may have crossed a tipping point have been rekindled by recent observations establishing that the Arctic has been melting much more quickly than many scientists had predicted.
Significant changes in the Arctic environment could lead to dramatic swings in weather and climate patterns across the rest of the globe, with potentially far-reaching consequences for ecosystems and human populations. The influx of large amounts of freshwater into the northern Atlantic Ocean from a melting Arctic ice cap, for example, and the Greenland ice sheet, may alter the Atlantic Themohaline Circulation, which brings warm water north from the Caribbean to North Europe. According to some scientists, a change is this circulation that might occur in next 100 years if current climate trends are not reversed. The collapse of one system may lead to the collapse of other systems, causing highly disruptive changes over relatively short time periods. Dr. James Hansen has warned that the earth's climate system is reaching dangerous tipping points, that "elements of a 'perfect storm', a global cataclysm, are assembled." Hansen warns that, "The tipping point for life on the plant will occur when so many interdependent species are lost that ecosystems collapse."

Observed changes in (a) global average surface temperature; (b) global average sea level from tide gauge (blue) and satellite (red) data; and (c) Northern Hemisphere snow cover for March-April. All differences are relative to corresponding averages for the period 1961-1990. Smoothed curves represent decadal averaged values while circles show yearly values. The shaded areas are the uncertainty intervals estimated from a comprehensive analysis of known uncertainties (a and b) and from the time series (c).

Locations of significant changes in data series of physical systems (snow, ice and frozen ground; hydrology; and coastal processes) and biological systems (terrestrial, marine, and freshwater biological systems), are shown together with surface air temperature changes over the period 1970- 2004. A subset of about 29,000 data series was selected from about 80,000 data series from 577 studies. These met the following criteria: (1) ending in 1990 or later; (2) spanning a period of at least 20 years; and (3) showing a significant change in either direction, as assessed in individual studies. These data series are from about 75 studies (of which about 70 are new since the TAR) and contain about 29,000 data series, of which about 28,000 are from European studies. White areas do not contain sufficient observational climate data to estimate a temperature trend. The 2 x 2 boxes show the total number of data series with significant changes (top row) and the percentage of those consistent with warming (bottom row) for (i) continental regions: North America (NAM), Latin America (LA), Europe (EUR), Africa (AFR), Asia (AS), Australia and New Zealand (ANZ), and Polar Regions (PR) and (ii) global-scale: Terrestrial (TER), Marine and Freshwater (MFW), and Global (GLO). The numbers of studies from the seven regional boxes (NAM, …, PR) do not add up to the global (GLO) totals because numbers from regions except Polar do not include the numbers related to Marine and Freshwater (MFW) systems. Locations of large area marine changes are not shown on the map.

(a) Global annual emissions of anthropogenic GHGs from 1970 to 2004. (b) Share of different anthropogenic GHGs in total emissions in 2004 in terms of CO2-eq. (c) Share of different sectors in total anthropogenic GHG emissions in 2004 in terms of CO2-eq. (Forestry includes deforestation.)

Comparison of observed continental- and global-scale changes in surface temperature with results simulated by climate models using either natural or both natural and anthropogenic forcings. Decadal averages of observations are shown for the period 1906-2005 (black line) plotted against the centre of the decade and relative to the corresponding average for the 1901-1950. Lines are dashed where spatial coverage is less than 50%. Blue shaded bands show the 5 to 95% range for 19 simulations from five climate models using only the natural forcings due to solar activity and volcanoes. Red shaded bands show the 5 to 95% range for 58 simulations from 14 climate models using both natural and anthropogenic forcings.


Warming of the climate system is unequivocal, as is now evident from observations of increases in global average air and ocean temperatures, widespread melting of snow and ice and rising global average sea level.[Ed. note: Anyone wishing to marvel over the sudden near-impeccabletude of the formatting of this post, can thank ME. —99].
Many natural systems, on all continents and in some oceans, are being affected by regional climate changes. Observed changes in many physical and biological systems are consistent with warming.
As a result of the uptake of anthropogenic CO2 since 1750, the acidity of the surface ocean has increased.
Global total annual anthropogenic GHG emissions, weighted by their 100-year GWPs, have grown by 70% between 1970 and 2004. As a result of anthropogenic emissions, atmospheric concentrations of N2O now far exceed pre-industrial values spanning many thousands of years, and those of CH4 and CO2 now far exceed the natural range over the last 650,000 years.
Most of the global average warming over the past 50 years is very likely due to anthropogenic GHG increases and it is likely that there is a discernible human-induced warming averaged over each continent (except Antarctica).
Anthropogenic warming over the last three decades has likely had a discernible influence at the global scale on observed changes in many physical and biological systems.
The pattern of future warming where land warms more than the adjacent oceans and more in northern high latitudes is seen in all scenarios.
Warming tends to reduce terrestrial ecosystem and ocean uptake of atmospheric CO2, increasing the fraction of anthropogenic emissions that remains in the atmosphere.
Anthropogenic warming and sea level rise would continue for centuries even if GHG emissions were to be reduced sufficiently for GHG concentrations to stabilize, due to the time scales associated with climate processes and feedbacks.
Equilibrium climate sensitivity is very unlikely to be less than 1.5°C.
Some systems, sectors and regions are likely to be especially affected by climate change. The systems and sectors are some ecosystems (tundra, boreal forest, mountain, Mediterranean-type, mangroves, salt marshes, coral reefs and the sea-ice biome), low-lying coasts, water resources in some dry regions at mid-latitudes and in the dry topics and in areas dependent on snow and ice melt, agriculture in low-latitude regions, and human health in areas with low adaptive capacity. The regions are the Arctic, Africa, small islands and Asian and African megadeltas. Within other regions, even those with high incomes, some people, areas and activities can be particularly at risk.
Impacts are very likely to increase due to increased frequencies and intensities of some extreme weather events. Recent events have demonstrated the vulnerability of some sectors and regions, including in developed countries, to heat waves, tropical cyclones, floods and drought, providing stronger reasons for concern as compared to the findings of the TAR. [IPCC's Third Assessment Report - 2001]


It's always been a disturbing what-if scenario for climate researchers: Gas hydrates stored in the Arctic ocean floor -- hard clumps of ice and methane, conserved by freezing temperatures and high pressure -- could grow unstable and release massive amounts of methane into the atmosphere. Since methane is a potent greenhouse gas, more worrisome than carbon dioxide, the result would be a drastic acceleration of global warming. Until now this idea was mostly academic; scientists had warned that such a thing could happen. Now it seems more likely that it will.
.................
Russian polar scientists have strong evidence that the first stages of melting are underway. They've studied [the] largest shelf sea in the world, off the coast of Siberia, where the Asian continental shelf stretches across an underwater area six times the size of Germany, before falling off gently into the Arctic Ocean. The scientists are presenting their data from this remote, thinly-investigated region at the annual conference of the European Geosciences Union this week in Vienna.
The permafrost has grown porous, says Shakhova [coauthor of the Russian study], and already the shelf sea has become "a source of methane passing into the atmosphere." The Russian scientists have estimated what might happen when this Siberian permafrost-seal thaws completely and all the stored gas escapes. They believe the methane content of the planet's atmosphere would increase twelvefold. "The result would be catastrophic global warming," say the scientists. The greenhouse-gas potential of methane is 20 times that of carbon dioxide, as measured by the effects of a single molecule.


 [click to enlarge]
 [click images to enlarge]


"Water is our life - it's our jobs and it's our food," said Ryan Jacobsen, executive director of the farm bureau in Fresno County. "Without a reliable water supply, Fresno County's No. 1 employer - agriculture - is at great risk."
The drought would cause an estimated $1.15 billion dollar loss in agriculture-related wages and eliminate as many as 40,000 jobs in farm-related industries in the San Joaquin Valley alone, where most of the nation's produce and nut crops are grown, said Lester Snow, director of the Department of Water Resources.
Last August, a Federal court set limits on pumping from the Delta, in an attempt to help endangered smelt fish. In a further measure to protect smelt, the U.S. Bureau of Reclamation announced just last week it would cut San Joaquin Valley farm water supplies to 40% of the contracted amount. Many of the farmers in the region have been allotted only one sixth of the water supply they need to sustain their crops through the crucial summer months. "This is a death sentence," says almond and wine farmer Shawn Coburn.
And the local farmers are particularly bitter at the environmental priorities governing water use. "We're looking after fish, and yet we're losing crops," says almond farmer Cort Blackburn. "You cannot put the fish in front of all the people." Chris Cardella, a farmer on the east side of Firebaugh, agrees: "We need legislature to overrule all our environmental impacts because humans come first over fish." California Farm Bureau Federation President Doug Mosebar dismisses such "myopic" thinking: "If we're assisting the fish, we're also assisting our food production." He hopes this crisis will spawn better infrastructure for moving and storing water. "We're at a crossroads right now," he says. "This is a wakeup call."
"The consequences are expected to be pretty horrible in terms of farmers' revenue, but what's really disconcerting are the possible job losses," said Wendy Martin, who leads the agency's drought division. "Those communities that can least weather an economic downturn are going to be some of the places that are hit the hardest."
Richard Howitt, a professor of agriculture economics at the University of California, Davis, estimates that $1.6 billion in agriculture-related wages, and as many as 60,000 jobs across the valley will be lost in the coming months due to dwindling water.
Analysts haven't yet provided any estimates of crop losses this year. But Bill Diedrich, an almond grower on the valley's parched western edge, said he's already worried he may lose some of his nut trees in the drought.
"The real story here is food security," Diedrich told Milligan and other officials speaking at a conference in Reno, Nev. "It's an absolute emergency and anything to get water flowing quickly is needed."
Across the valley, towns are already seeing some of the worst unemployment in the country, with rates three and four times the national average, as well as reported increases in all manner of social ills: drug use, excessive drinking and rises in hunger and domestic violence.
With fewer checks to cash, even check-cashing businesses have failed, as have thrift stores, ice cream parlors and hardware shops. The state has put the 2008 drought losses at more than $300 million, and economists predict that this year’s losses could swell past $2 billion, with as many as 80,000 jobs lost.
“People are saying, ‘Are you a third world country?’ ” said Robert Silva, the mayor of Mendota, which has a 35 percent unemployment rate, up from the more typical seasonal average of about 20 percent. “My community is dying on the vine.”
“Fish need water to survive,” said Doug Obegi, staff attorney at the Natural Resources Defense Council. “Today’s opinion reflects the conclusion of numerous scientists and the Governor’s own task force, who all agree that the delta smelt need additional protections to keep them from going extinct. The opinion requires the state and federal water projects to operate in a more environmentally sustainable manner that better protects delta smelt, salmon, and the fishermen and farmers who depend on healthy fisheries and clean water.”


 WE'RE NOT IN KANSAS ANYMORE!


 Self-portrait, header and footer photos by Bluebear2


