
Wednesday, August 25, 2010
Friday, August 20, 2010

From an article titled Climate change basics III – environmental impacts and tipping points:
The world’s climate is inherently dynamic and changeable. Past eons have borne witness to a planet choked by intense volcanic activity, dried out in vast circumglobal deserts, heated to a point where polar oceans were as warm as subtropical seas, and frozen in successive ice ages that entombed northern Eurasia and America under miles of ice. These changes to the Earth’s environment imposed great stresses upon ecosystems and often led to mass extinctions of species. Life always went on, but the world was inevitably a very different place.
We, a single species, are now the agent of global change. We are undertaking an unplanned and unprecedented experiment in planetary engineering, which has the potential to unleash physical and biological transformations on a scale never before witnessed by civilization.
When climate change is discussed in the modern context, it is usually with reference to global warming, caused by anthropogenic pollution from the burning of fossil fuels. Since the furnaces of the industrial revolution were first ignited a few centuries ago, we have treated the atmosphere as an open sewer, dumping into it more a trillion tonnes of heat-trapping carbon dioxide (CO2), as well as methane, nitrous oxide and ozone-destroying CFCs. The atmospheric concentration of CO2 is now nearly 40% higher than at any time over the past million years...
From Climate Lab:
To examine possible tipping points in the earth's systems, the authors of the article, Tipping elements in the Earth's climate system, gathered data, reviewed literature and solicited opinions from climate experts on potential tipping elements in the earth's climate systems. Table 1 outlines nine of the most policy-relevant tipping elements they examined, the amount of global warming needed to cause the elements to tip, the timescales for warming, and a summary of key impacts of the warming.
[click illustrations to enlarge and clarify]
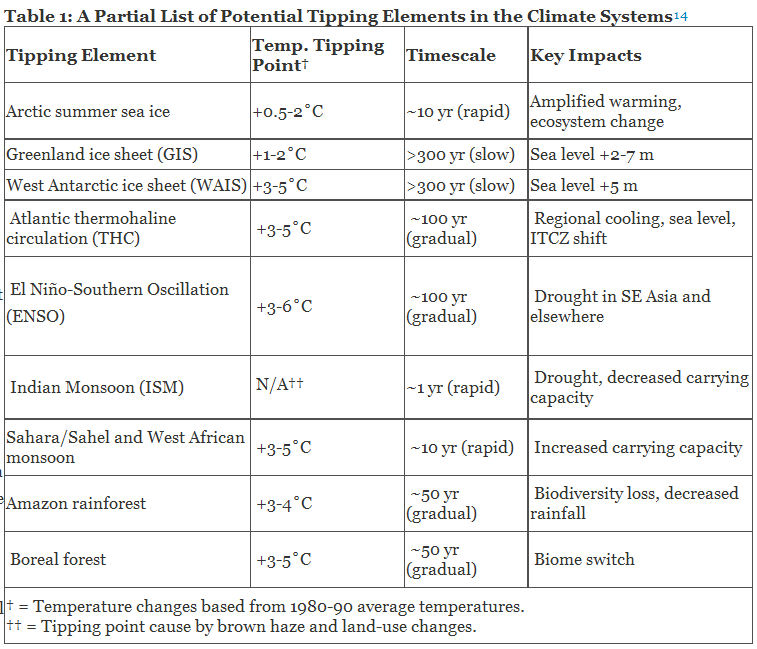
The authors of this study conclude that summer Arctic sea ice may be lost within 10 years. A number of other climate scientists note that albedo feedback makes summer and fall sea ice sensitive to moderate increases in temperature and that studies have shown that once sea ice retreats to a certain point, remaining ice can be lost without additional temperature increases. Concerns that the Arctic may have crossed a tipping point have been rekindled by recent observations establishing that the Arctic has been melting much more quickly than many scientists had predicted.
Significant changes in the Arctic environment could lead to dramatic swings in weather and climate patterns across the rest of the globe, with potentially far-reaching consequences for ecosystems and human populations. The influx of large amounts of freshwater into the northern Atlantic Ocean from a melting Arctic ice cap, for example, and the Greenland ice sheet, may alter the Atlantic Themohaline Circulation, which brings warm water north from the Caribbean to North Europe. According to some scientists, a change is this circulation that might occur in next 100 years if current climate trends are not reversed. The collapse of one system may lead to the collapse of other systems, causing highly disruptive changes over relatively short time periods. Dr. James Hansen has warned that the earth's climate system is reaching dangerous tipping points, that "elements of a 'perfect storm', a global cataclysm, are assembled." Hansen warns that, "The tipping point for life on the plant will occur when so many interdependent species are lost that ecosystems collapse."
The following illustrations and conclusion are from the Intergovernmental Panel on Climate Change's publication Climate Change 2007: Synthesis Report (AR4):

Observed changes in (a) global average surface temperature; (b) global average sea level from tide gauge (blue) and satellite (red) data; and (c) Northern Hemisphere snow cover for March-April. All differences are relative to corresponding averages for the period 1961-1990. Smoothed curves represent decadal averaged values while circles show yearly values. The shaded areas are the uncertainty intervals estimated from a comprehensive analysis of known uncertainties (a and b) and from the time series (c).

Locations of significant changes in data series of physical systems (snow, ice and frozen ground; hydrology; and coastal processes) and biological systems (terrestrial, marine, and freshwater biological systems), are shown together with surface air temperature changes over the period 1970- 2004. A subset of about 29,000 data series was selected from about 80,000 data series from 577 studies. These met the following criteria: (1) ending in 1990 or later; (2) spanning a period of at least 20 years; and (3) showing a significant change in either direction, as assessed in individual studies. These data series are from about 75 studies (of which about 70 are new since the TAR) and contain about 29,000 data series, of which about 28,000 are from European studies. White areas do not contain sufficient observational climate data to estimate a temperature trend. The 2 x 2 boxes show the total number of data series with significant changes (top row) and the percentage of those consistent with warming (bottom row) for (i) continental regions: North America (NAM), Latin America (LA), Europe (EUR), Africa (AFR), Asia (AS), Australia and New Zealand (ANZ), and Polar Regions (PR) and (ii) global-scale: Terrestrial (TER), Marine and Freshwater (MFW), and Global (GLO). The numbers of studies from the seven regional boxes (NAM, …, PR) do not add up to the global (GLO) totals because numbers from regions except Polar do not include the numbers related to Marine and Freshwater (MFW) systems. Locations of large area marine changes are not shown on the map.
from the influence of human beings

(a) Global annual emissions of anthropogenic GHGs from 1970 to 2004. (b) Share of different anthropogenic GHGs in total emissions in 2004 in terms of CO2-eq. (c) Share of different sectors in total anthropogenic GHG emissions in 2004 in terms of CO2-eq. (Forestry includes deforestation.)

Comparison of observed continental- and global-scale changes in surface temperature with results simulated by climate models using either natural or both natural and anthropogenic forcings. Decadal averages of observations are shown for the period 1906-2005 (black line) plotted against the centre of the decade and relative to the corresponding average for the 1901-1950. Lines are dashed where spatial coverage is less than 50%. Blue shaded bands show the 5 to 95% range for 19 simulations from five climate models using only the natural forcings due to solar activity and volcanoes. Red shaded bands show the 5 to 95% range for 58 simulations from 14 climate models using both natural and anthropogenic forcings.
IMPACTS

MITIGATION

In Conclusion:
Warming of the climate system is unequivocal, as is now evident from observations of increases in global average air and ocean temperatures, widespread melting of snow and ice and rising global average sea level.[Ed. note: Anyone wishing to marvel over the sudden near-impeccabletude of the formatting of this post, can thank ME. —99].
Many natural systems, on all continents and in some oceans, are being affected by regional climate changes. Observed changes in many physical and biological systems are consistent with warming.
As a result of the uptake of anthropogenic CO2 since 1750, the acidity of the surface ocean has increased.
Global total annual anthropogenic GHG emissions, weighted by their 100-year GWPs, have grown by 70% between 1970 and 2004. As a result of anthropogenic emissions, atmospheric concentrations of N2O now far exceed pre-industrial values spanning many thousands of years, and those of CH4 and CO2 now far exceed the natural range over the last 650,000 years.
Most of the global average warming over the past 50 years is very likely due to anthropogenic GHG increases and it is likely that there is a discernible human-induced warming averaged over each continent (except Antarctica).
Anthropogenic warming over the last three decades has likely had a discernible influence at the global scale on observed changes in many physical and biological systems.
The pattern of future warming where land warms more than the adjacent oceans and more in northern high latitudes is seen in all scenarios.
Warming tends to reduce terrestrial ecosystem and ocean uptake of atmospheric CO2, increasing the fraction of anthropogenic emissions that remains in the atmosphere.
Anthropogenic warming and sea level rise would continue for centuries even if GHG emissions were to be reduced sufficiently for GHG concentrations to stabilize, due to the time scales associated with climate processes and feedbacks.
Equilibrium climate sensitivity is very unlikely to be less than 1.5°C.
Some systems, sectors and regions are likely to be especially affected by climate change. The systems and sectors are some ecosystems (tundra, boreal forest, mountain, Mediterranean-type, mangroves, salt marshes, coral reefs and the sea-ice biome), low-lying coasts, water resources in some dry regions at mid-latitudes and in the dry topics and in areas dependent on snow and ice melt, agriculture in low-latitude regions, and human health in areas with low adaptive capacity. The regions are the Arctic, Africa, small islands and Asian and African megadeltas. Within other regions, even those with high incomes, some people, areas and activities can be particularly at risk.
Impacts are very likely to increase due to increased frequencies and intensities of some extreme weather events. Recent events have demonstrated the vulnerability of some sectors and regions, including in developed countries, to heat waves, tropical cyclones, floods and drought, providing stronger reasons for concern as compared to the findings of the TAR. [IPCC's Third Assessment Report - 2001]
Thursday, August 19, 2010

Wednesday, August 18, 2010
Broken Promises - Deportees
President Barack Obama has said his government would take on the thorny issue of immigration policy reform.BUT
First year of Obama administration sees record amount of deportations.LINK
The New Colossus
Emma LazarusNot like the brazen giant of Greek fame,With conquering limbs astride from land to land;Here at our sea-washed, sunset gates shall standA mighty woman with a torch, whose flameIs the imprisoned lightning, and her nameMother of Exiles. From her beacon-handGlows world-wide welcome; her mild eyes commandThe air-bridged harbor that twin cities frame."Keep ancient lands, your storied pomp!" cries sheWith silent lips. "Give me your tired, your poor,Your huddled masses yearning to breathe free,The wretched refuse of your teeming shore.Send these, the homeless, tempest-tost to me,I lift my lamp beside the golden door!"
Liberty
Obama's version
.
Sunday, August 15, 2010
WTF Is Going On?
This is unreal! At first I thought it was a changing camera angle, until the floor dropped. Upon a second viewing it is obvious it is not the camera angle. The ROV on the left remains stationary as does the the other probe on the right. Only the seafloor changes.
Days After Tar Balls Hit New York Beach Massive Fish Kills Stretch From New Jersey to Massachusetts
Tar balls in New York? Looks like this animation was right on the mark!
So it is capped - right? Guess again:
Static Kill - Fail
More Deepwater Horizon coverage at the Lair
.
Wednesday, August 11, 2010
Toxocology of the Gulf
Grab your coffee for this one, lots of good information, but her speaking style, to say the least, is not very stimulating...
Video 17:14
Independent scientists being kept from investigating the effects of the spill.
Matt Simmons silenced - an accident?
The BP Cover-Up
More Deepwater Horizon coverage at the Lair
Video 17:14
Independent scientists being kept from investigating the effects of the spill.
Matt Simmons silenced - an accident?
The BP Cover-Up
More Deepwater Horizon coverage at the Lair
.
Sunday, August 08, 2010

Saturday, August 07, 2010
Back to Grade School 1950's
A Refresher Course
.Due to current events it is time to travel back and refresh our memories of what do
A Is for Atom Video 14:43
The War Game Video 46:24
The Truth Game Video 1:19:17 (Now complete with final segment)
.
when...
A Is for Atom Video 14:43
The War Game Video 46:24
The Truth Game Video 1:19:17 (Now complete with final segment)
.
Thursday, August 05, 2010
Tuesday, August 03, 2010
You're Doing One Heck of a Job BP!
Now BP wants to scale back the cleanup, but as shrimper ERIC ABAIR points out
We've got way too much oil in the Gulf not accounted for, and basically the way we feel out here, until it's all gone in the Gulf, nothing should be cut back.


What BP and US Government Don't Want You to Know - Democracy NOW!
More Deepwater Horizon coverage at the Lair
.
Sunday, August 01, 2010
Subscribe to:
Comments (Atom)